#IoT Resource Tree Representation for Massive Data Sets Introduction:
The goal of this project is to provide a webapp to visualize 1 million+ data points collected from OpenDaylight (ODL). Visual aids must give the user a sense for extracting meaning from these mass quantities of data in an intuitive way. Our solution will contain management functions for adding, editing or deleting nodes from the tree. We also want minimize the client/server side response time to provide a fluid user experience. This documentation should serve as a means of describing our system as well as configuring it for use.
##System Overview:
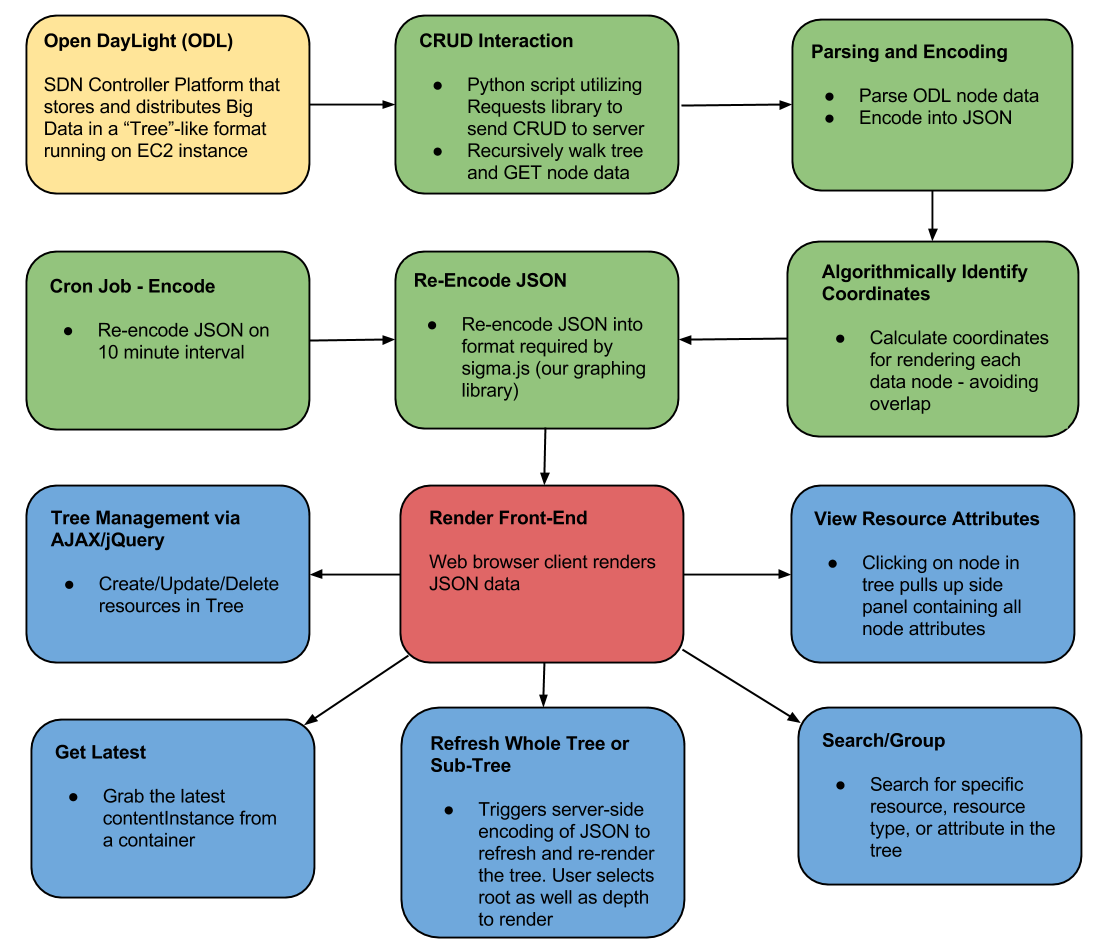
Legend
Yellow = EC2 Instance
Green = Server-side Execution
Red = Web Browser
Blue = Client-side User Functionality in browser
Description
Open DayLight is a Software Defined Networking Controller platform used for big data collection and distribution. We are running this as a server on our EC2 instance.
You interact with this ODL server through CRUD operations sent through HTTP.
We utilized the Python Library Requests to recursively walk through our tree and retrieve all of the attributes for each node.
Next we parsed all of the data we retrieved from each node into a cumulative JSON format
We use the shape of the tree and the number of nodes to calculate the position for each node in the visual to minimize overlap when rendering.
Finally we re-encode our JSON into the format required by sigma.js, our visualization library.
However, walking the tree and generating the corresponding sigma.js JSON can take quite a long time as trees get very large. This is much too long for a user to wait when loading up the visualization in the web browser. To combat this, rather than generating the JSON on demand, we pre-compile it, and merely serve up the static JSON file to the client’s web browser. This ensure we have super smooth and low latency render.
We have a Cron job on the server that generates a new JSON file every 10 minute. This gives us near “real-time” visualization client-side without incurring a time-penalty.
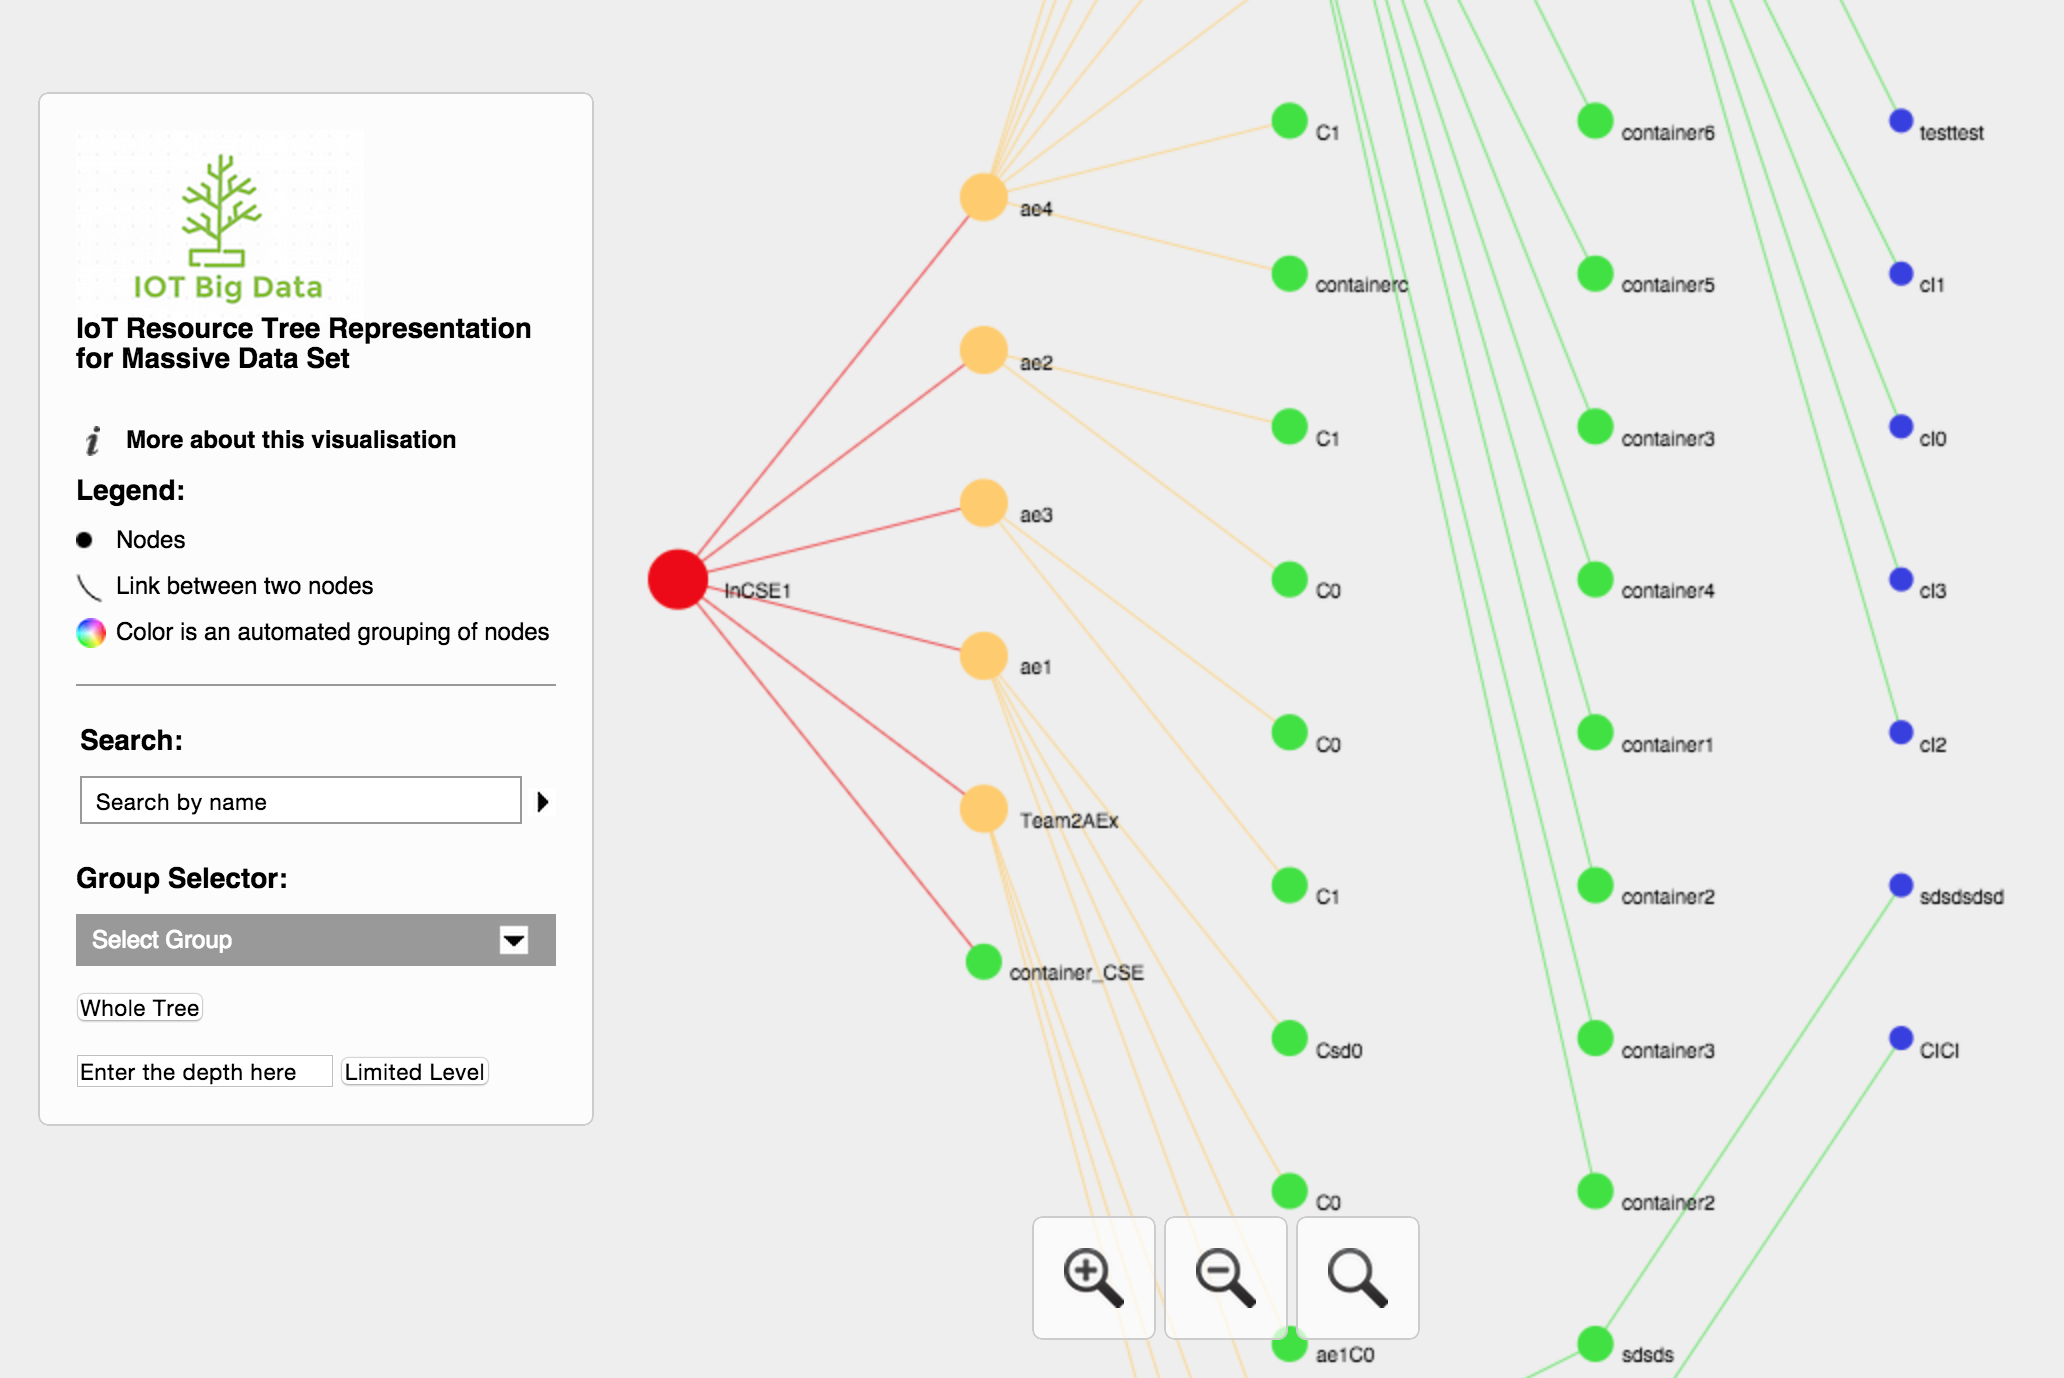
This is a screen shot of our visual running in ChromeYou can zoom in and zoom out of the tree by clicking the + and - magnifying buttons in the center console. You can also move the tree by clicking and dragging it. You can easily filter or search the visualization if you know the name of a specific resource or attribute using the search bar on the left. Right below the search bar is the group selector which allows selecting and rendering only resources of a specific type (eg: container).
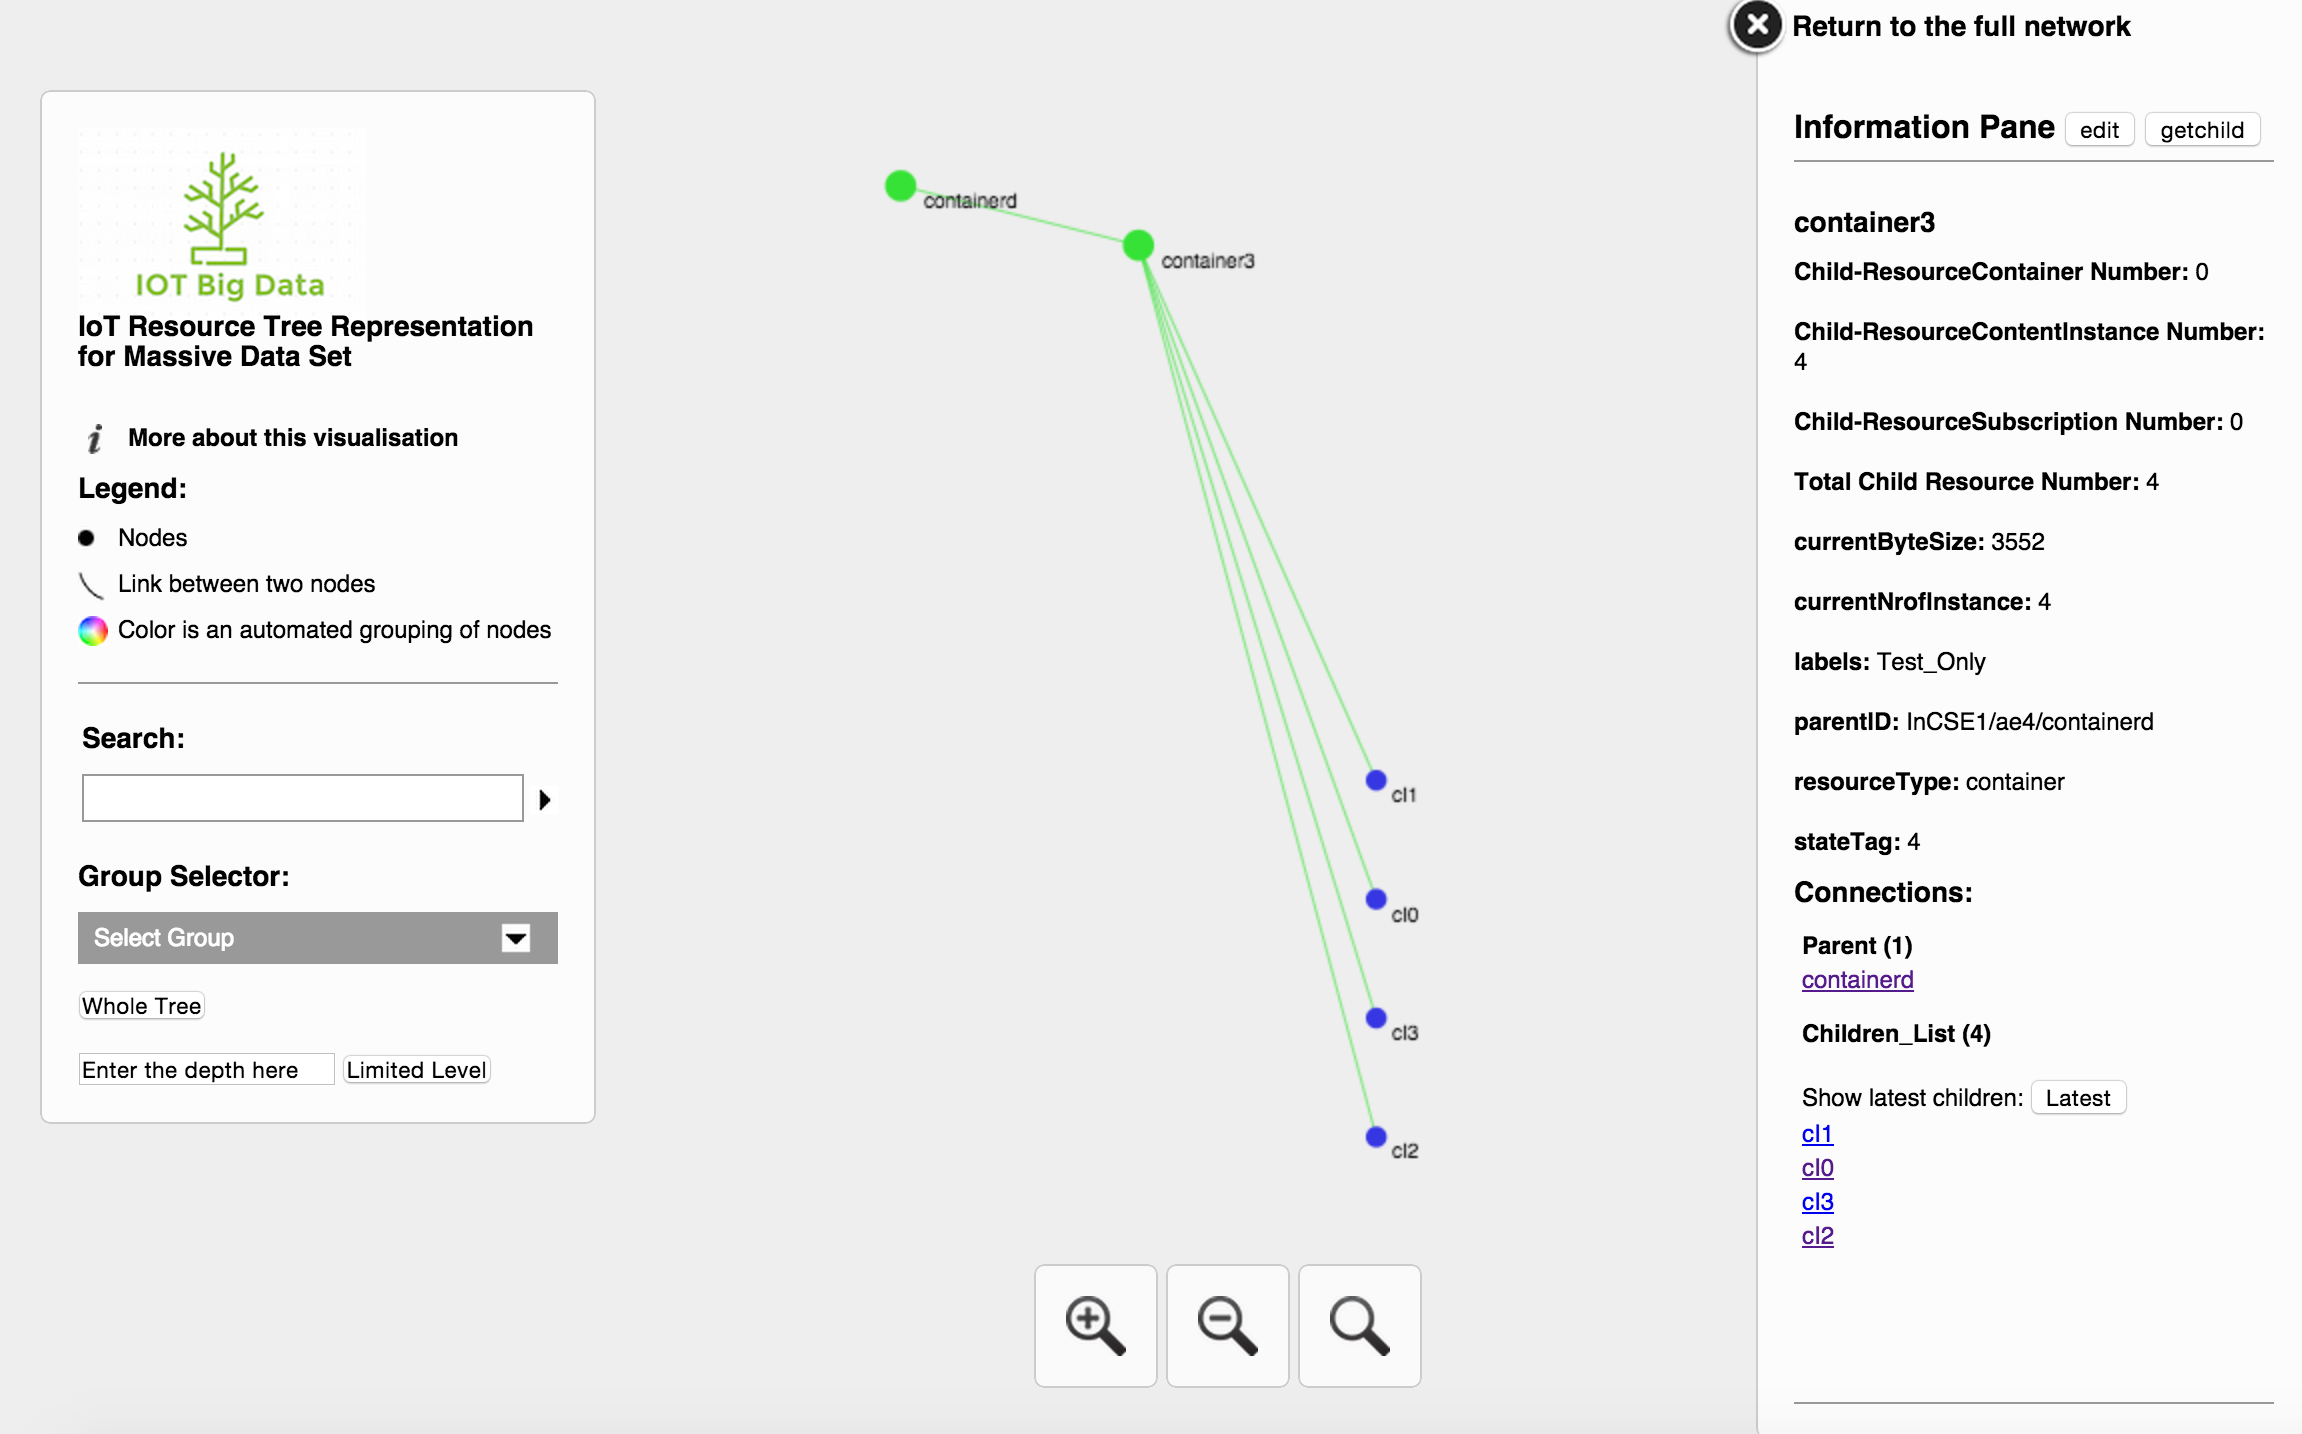
Clicking on a resource such as an AE, Container, or contentInstance will render exclusively that node along with its parent and children. It also pulls up a side-panel containing all of the attributes of that node. Among these, include the resource’s name, ID, type, size, number of children, as well as links to its parent and child nodes.
Displaying a node with its parent and childrenFor nodes with an extremely large number of data points (called contentInstances), it may be difficult to find the most recent collected data. To make this easier, we’ve added a button called “latest” which will conveniently grab and display this latest data.
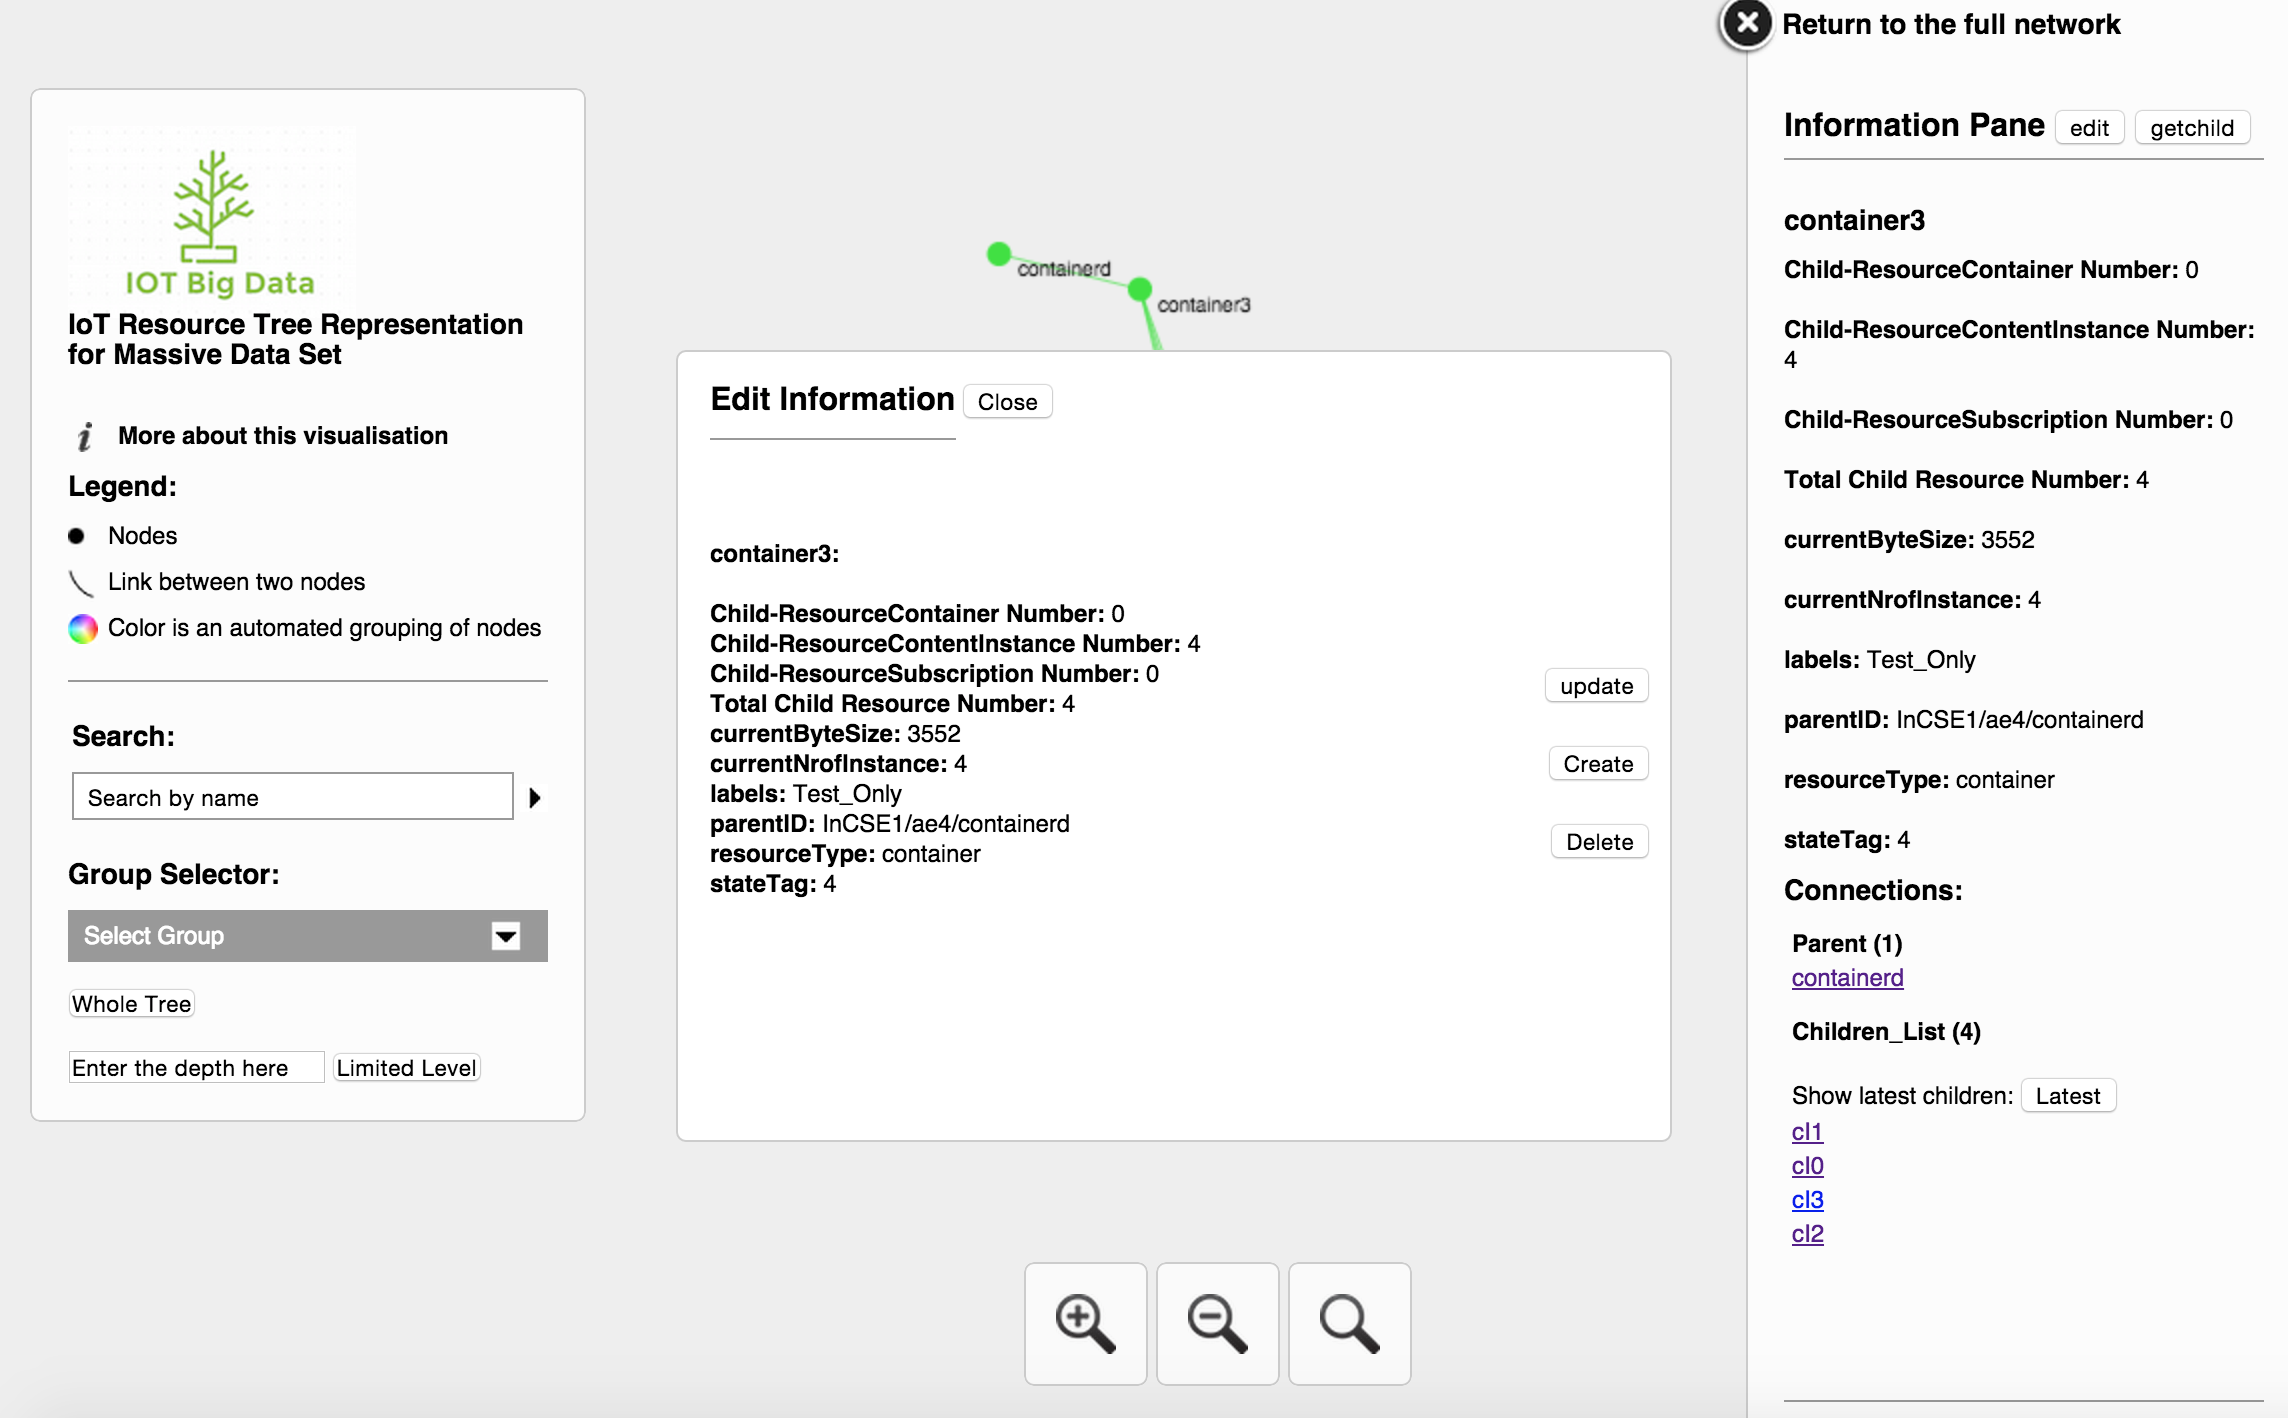
From this panel you can also click the edit button to modify the tree. You can edit or delete the existing node, or even create new ones. These CRUD calls to ODL are done via AJAX.
In order to be more real-time we’ve added the option to refresh the tree. The user can choose to either refresh the whole tree, thereby incurring a potentially large time penalty, OR choose to merely update the current node along with a user-specified level depth to render. This results in a MUCH quicker render while still giving the user the real-time data they want. We feel this is a very good trade-off between functionality and usability.
##Installation and Configuration
##Prerequisites 1. Install Python2 (https://www.python.org/downloads/)
2. Install Apache2 (http://apache.org/dyn/closer.cgi)
3. Clone iot-ui-bigdata repo:
git clone https://github.com/BU-EC500-SP15/iot-ui-bigdata.git
##Apache Configuration 1. Enable cgid
This will enable CGI processing in Apache so that it can execute python script on server side.
sudo a2enmod cgi
2. Modify Apache httpd or conf file
In Ubuntu system, Apache conf file location is:
/etc/apache2/apache.conf
Then add into it:
Notice: The directory path below is telling apache which folder can execute python, if you put /network folder to another place, you must change the directory path down below to let it point to location of /cgi-bin and /network.
<Directory /var/www/html/network/cgi-bin>
    Options ExecCGI
    SetHandler cgi-script
</Directory>

<Directory /var/www/html/network>
    Options +ExecCGI
    AddHandler cgi-script .py
</Directory>
After done this, restart apache server:
sudo service apache2 restart
3. Put everything into apache web server folder
Notice: The directory of /network folder can be changed as long as it can be hosted by Apache
cp -r iot-ui-bigdata/network /var/www/html/
4. Change the privilige of some file/folder
cd iot-ui-bigdata/network
sudo chmod a+rwx data/
cd iot-ui-bigdata/network/cgi-bin
sudo chmod 777 getTree.py
sudo chmod 777 getTreeDepthLimited.py
sudo chmod 777 getChild.py
##Configuring Cron Job
Compiling JSON on interval
This will make the server compile a new static JSON image of the tree every 10 minutes. This will be the data the user will see in their web browser visual. For smaller amounts of data you may want to lower this interval in order to behave more "real-time." For extremely large sets of data you may need to increase this interval for the server to be able to process the entire tree.
Open cronjob:
crontab -e
Write and save:
*/10 * * * * /usr/bin/python /PATH/TO/SCRIPT/getTree.py >/dev/null 2>&1
Change the interval by modifying the 10 value. (the / acts as a mod, with the first * signifying minutes and the second * signifying hours). For example an interval every 45 minutes would look like:
*/45 * * * * /usr/bin/python /PATH/TO/SCRIPT/getTree.py >/dev/null 2>&1
##Google Chrome and CORS
Due to recent updates in ODL, CRUD operations have been restricted for certain use-cases. We've identified a quick-fix to this bottleneck, however it exclusively works for Google Chrome. Hence we only support tree management operations in Google Chrome.
CORS
CORS (Allow-Control-Allow-Origin) is a plugin for Chrome which enables CRUD functionality for our visual. You can install it from the following link:
Once installed, view the visualization in your web browser. Make sure the CORS icon is visible in the top right corner of your browser. If it isn't go into your Chrome extensions and ensure that CORS is enabled. Once you see it, click on the CORS icon and toggle the "Enable cross-origin resource sharing" switch to ON. Now you are ready to use the tool!
##Using visualization tool
Access tool
After successfully following the above installation procedure, use this URL to access our visualization tool:
http://localhost/network/index.html?config=config_ukgov.json
And you are ready to go!
Tool on EC2
There is another replica of this tool on our EC2 instance, feel free to try it out.
http://54.68.184.172/network/index.html?config=config_ukgov.json
##Special Thanks
Instructors - Ata Turk(BU), Orran Krieger(BU), Peter Desnoyers(NEU), Michael Daitzman(Vecna), Jason Hennessey(BU) Mentors - Lionel Florit(Cisco), Jim Ballingall(IAP)
##Reference
Oxford Internet Institution(OII) Interactive Visualizations Blog
http://blogs.oii.ox.ac.uk/vis/
OII InteractiveVis github repo
https://github.com/oxfordinternetinstitute/InteractiveVis
Cross-origin resource sharing information
http://en.wikipedia.org/wiki/Cross-origin_resource_sharing
http://enable-cors.org


