简体中文 | English
A high performance, non-intrusive Java performance monitoring and statistical tool designed for high-concurrency, low-latency applications.
- High performance: Very low performance consumption, only 73 nano seconds per record, can be used in production environment for a long time.
- No intrusion: Using JavaAgent mode, no intrusion to the application, no need to modify the application code.
- Low memory: With memory multiplexing, only a small number of temporary objects are generated throughout the life cycle, and the GC of the application is not affected.
- High precision: Using nanoseconds to calculate response time.
- Real-time: Supports second level monitoring, minimum 1 second
- Quickly locate performance bottlenecks for Java applications in a development environment
- Long-term monitoring of performance metrics for Java applications in a production environment
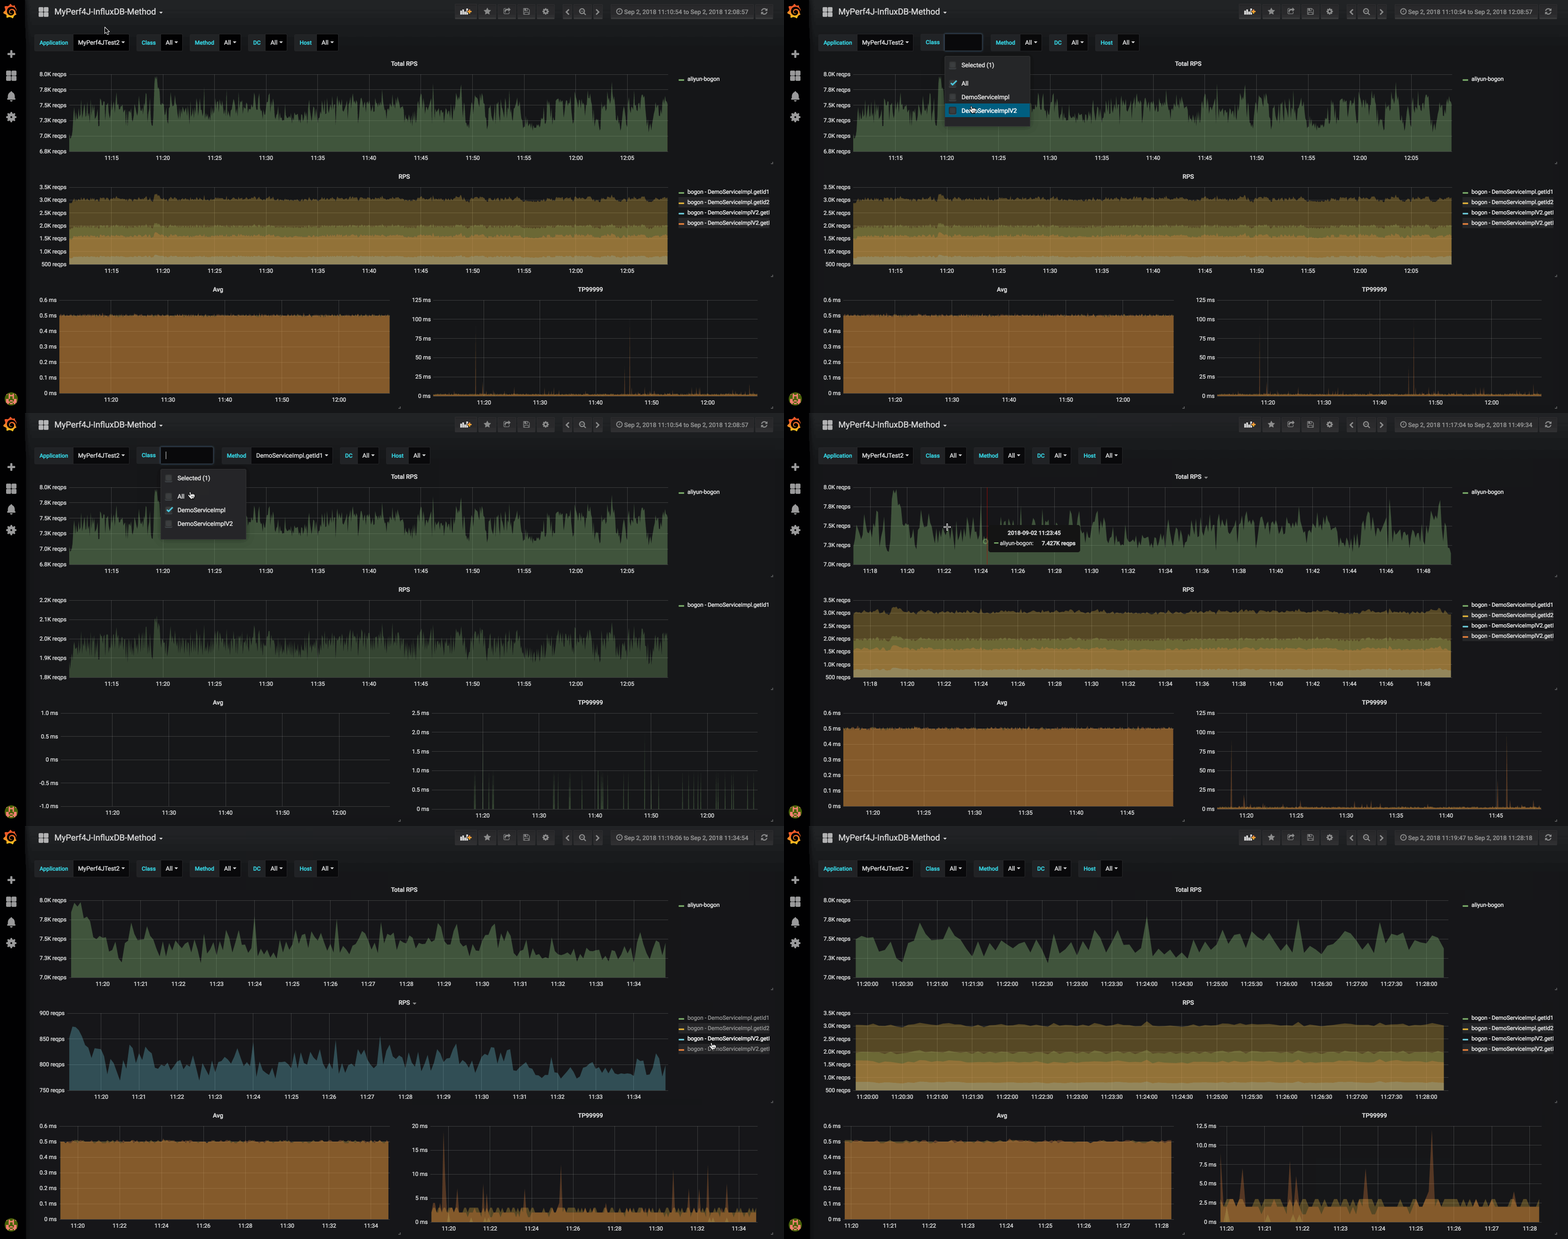
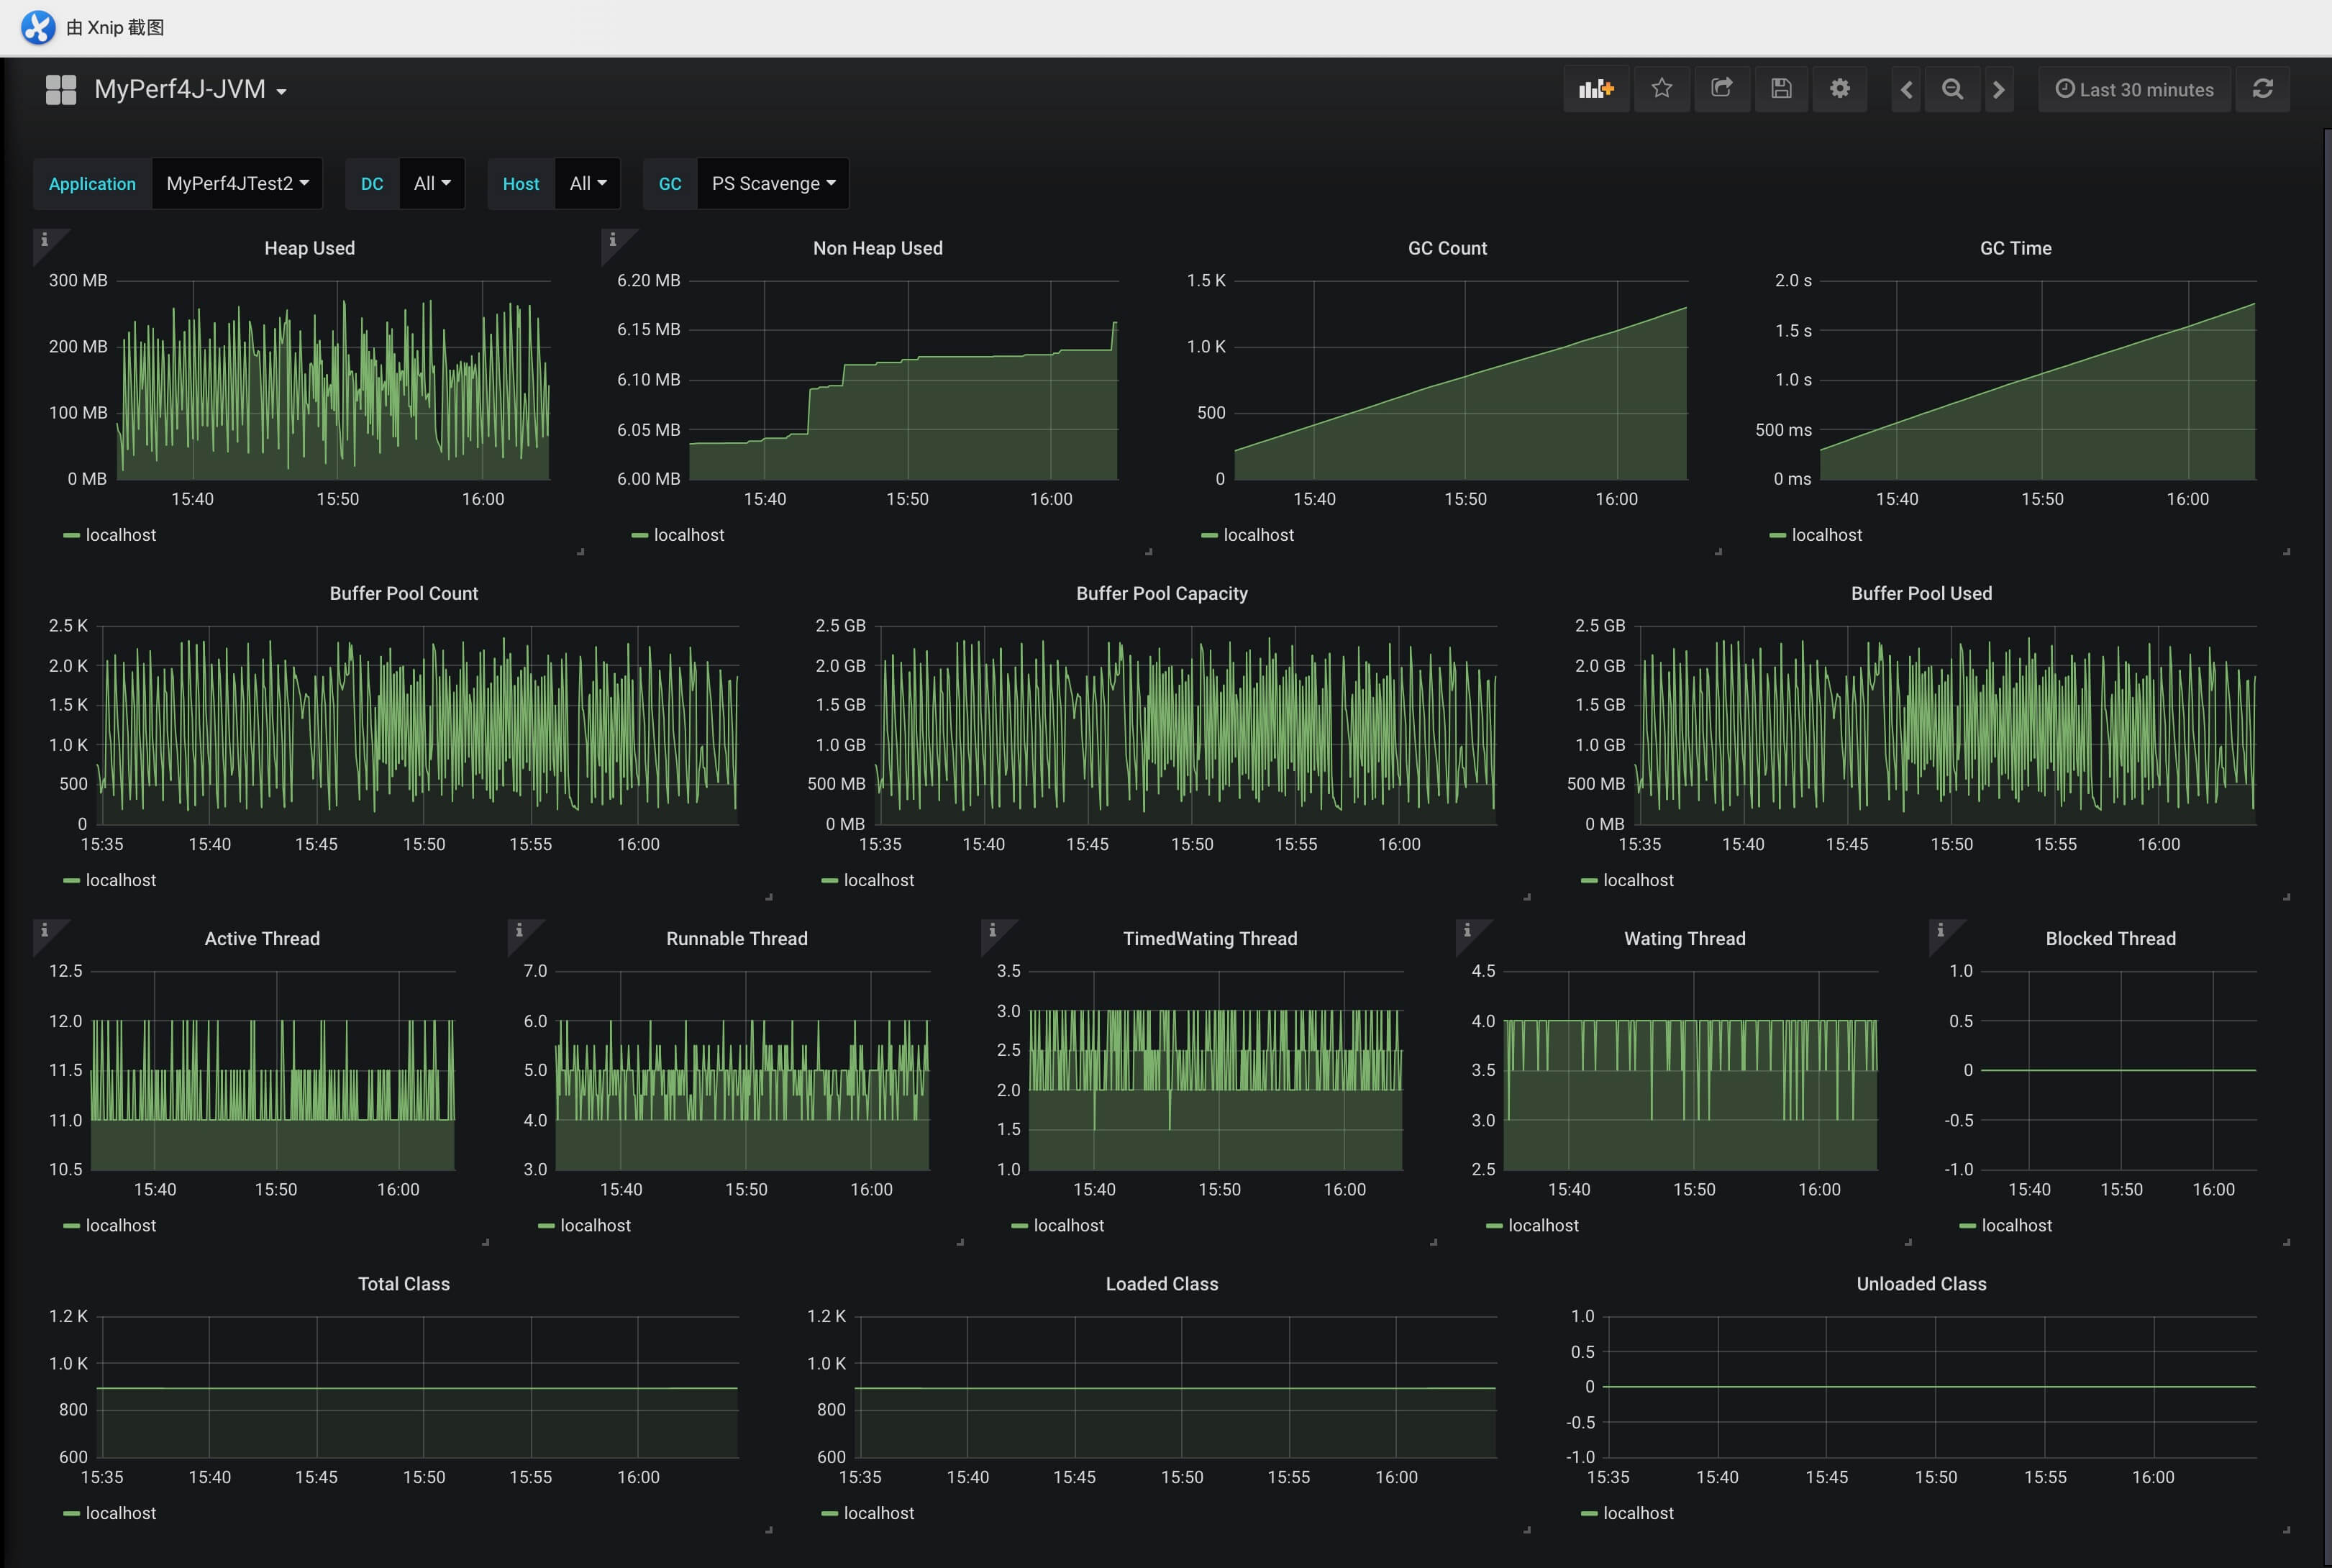
MyPerf4J collects dozens of metrics per application. All these metrics are collected and visualized in real-time.
This is a list of what it currently monitors:
- Method Metrics
RPS, Count, Avg, Min, Max, StdDev, TP50, TP90, TP95, TP99, TP999, TP9999, TP99999, TP100
- JVM Metrics
Thread,Memory,ByteBuff,GC,Class
Want to know how to achieve the above effect? Please start the application according to the description of Quick Start, and then follow the instructions in here to install and configure.
MyPerf4J adopts JavaAgent configuration mode, transparent access application, and the application code is completely no-intrusive.
- git clone [email protected]:LinShunKang/MyPerf4J.git
- mvn clean package
- Rename MyPerf4J-ASM-${MyPerf4J-version}.jar to MyPerf4J-ASM.jar
If you are using JDK 7 or higher, you can try to download MyPerf4J-ASM.jar directly.
Add the following two parameters to the JVM startup parameters
-javaagent:/your/path/to/MyPerf4J-ASM.jar -DMyPerf4JPropFile=/your/path/to/myPerf4J.properties
Among them, the configuration of MyPerf4JPropFile is as follows:
#Application name
AppName=MyPerf4JTest

#Configure MetricsProcessors type 0:Output to stdout.log in a standard formatted structure 1:Output to disk in standard formatted structure  2:Output to disk in InfluxDB LineProtocol format
MetricsProcessorType=1

#Config metrics log file, option
MethodMetricsFile=/data/logs/MyPerf4J/method_metrics.log
ClassMetricsFile=/data/logs/MyPerf4J/class_metrics.log
GCMetricsFile=/data/logs/MyPerf4J/gc_metrics.log
MemMetricsFile=/data/logs/MyPerf4J/memory_metrics.log
BufPoolMetricsFile=/data/logs/MyPerf4J/buf_pool_metrics
ThreadMetricsFile=/data/logs/MyPerf4J/thread_metrics.log

#configure TimeSlice, time unit: ms, min:1s, max:600s
MilliTimeSlice=60000

#configure packages, separated with ';'
IncludePackages=cn.perf4j;org.myperf4j;cn.perf4j.demo1.[p1,p2,p3];cn.*.demo.*
-
The output is to /data/logs/MyPerf4J/method_metrics.log:
MyPerf4J Method Metrics [2018-09-06 19:21:40, 2018-09-06 19:21:45]
Method[4]                           RPS  Avg(ms)  Min(ms)  Max(ms)   StdDev     Count     TP50     TP90     TP95     TP99    TP999   TP9999  TP99999    TP100
DemoServiceImpl.getId1(long)       1974     0.00        0        0     0.00      9870        0        0        0        0        0        0        0        0
DemoServiceImpl.getId2(long)       2995     0.50        0        2     0.01     14975        0        1        2        2        2        2        2        2
DemoServiceImplV2.getId1(long)      787     0.00        0        0     0.00      3938        0        0        0        0        0        0        0        0
DemoServiceImplV2.getId3(long)     1575     0.50        0        1     0.01      7876        1        1        1        1        1        1        1        1
Remove the following two parameters from the JVM startup parameters and restart to uninstall the tool.
-javaagent:/your/path/to/MyPerf4J-ASM.jar -DMyPerf4JPropFile=/your/path/to/myPerf4J.properties
If you encounter any issues or if you have a question, don't hesitate to create an issue or send email : )
For more information about the project, please see https://github.com/LinShunKang/MyPerf4J/wiki/English-Doc.


