Skip to content

Data visualization of development of the global COVID-19 pandemic

Notifications You must be signed in to change notification settings

guoyangqin/coronaviz

Folders and files

NameName
Last commit message
Last commit date

Latest commit


History

31 Commits


Repository files navigation

coronaviz

Daily data exploration and visualization tracking development of the global COVID-19 pandemic.

Author: Guoyang Qin

Latest data

COVID-19 data of 30+ countries (view list) with tracking records are collected from worldometers on a daily basis, with columns including number of cases and deaths. (download lastest .csv)

Latest viz

12 countries with most total cases are being monitored and visualized on a daily basis.

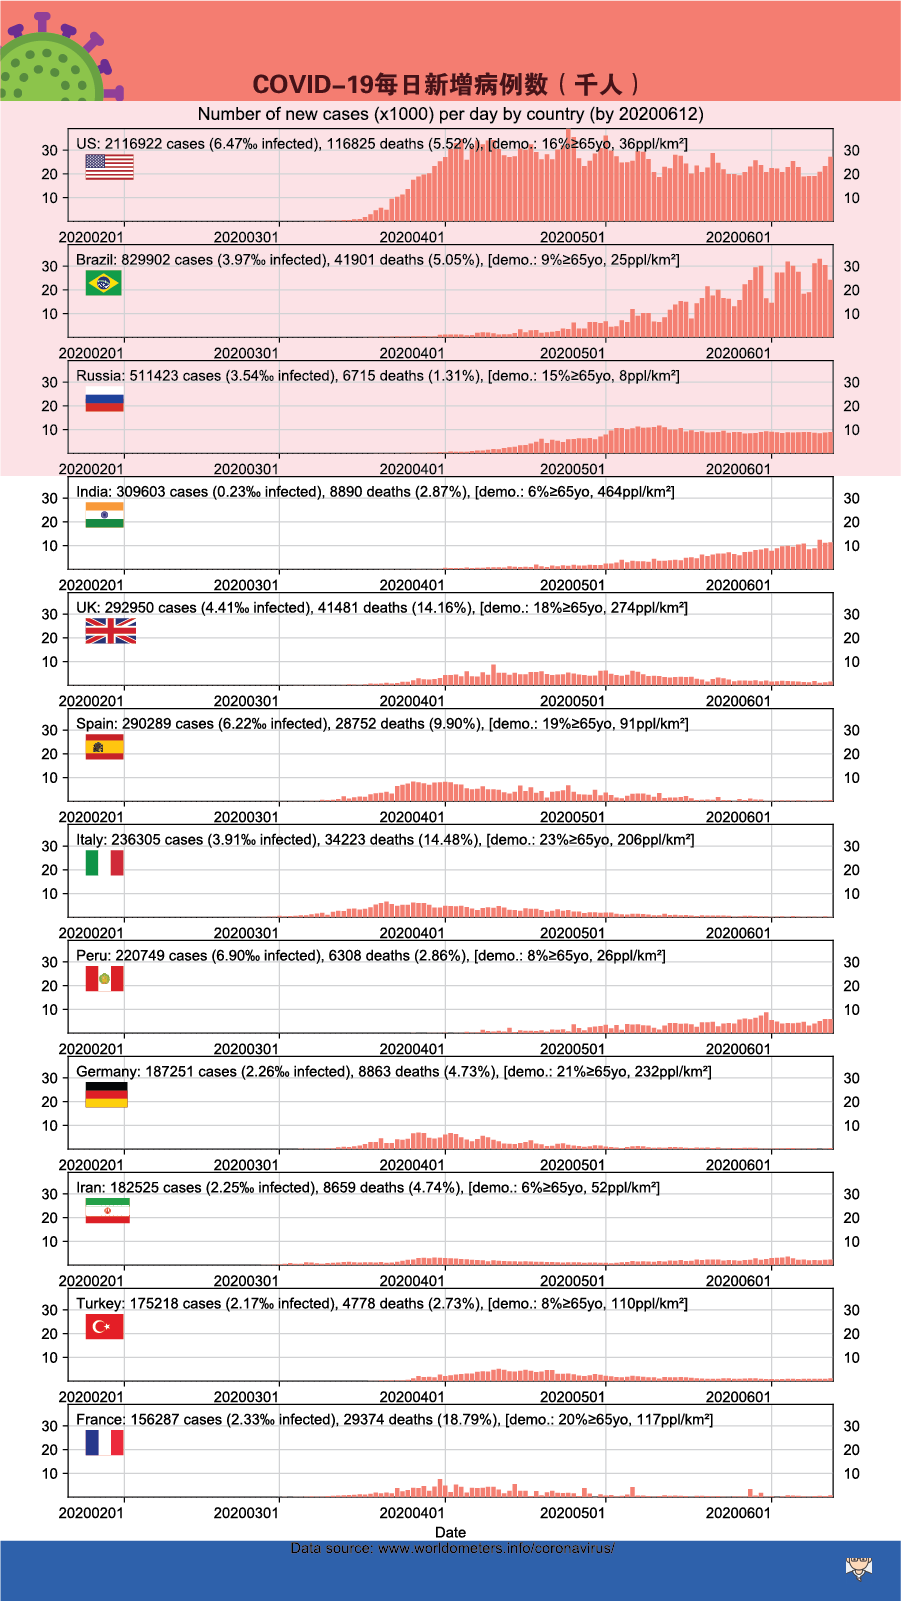
01 Number of new cases (×1000) per day by country

COVID-19 number of new cases (×1000) per day by country

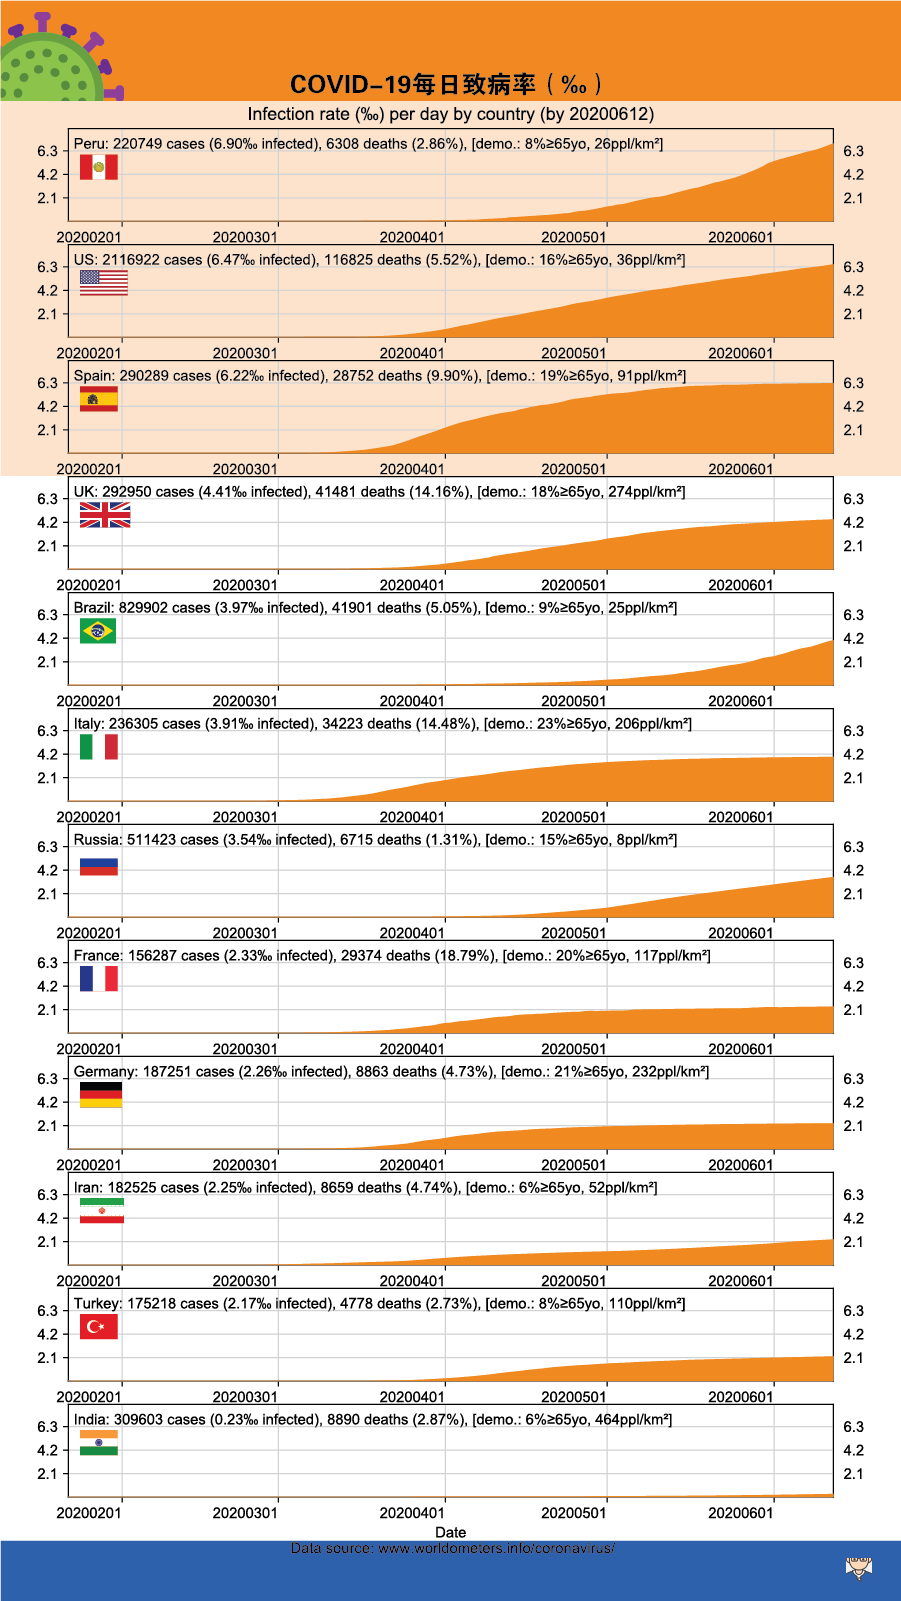
02 Infection rate (‰) per day by country

Infection rate := num. of total cases/population

COVID-19  infection rate (‰) per day by country

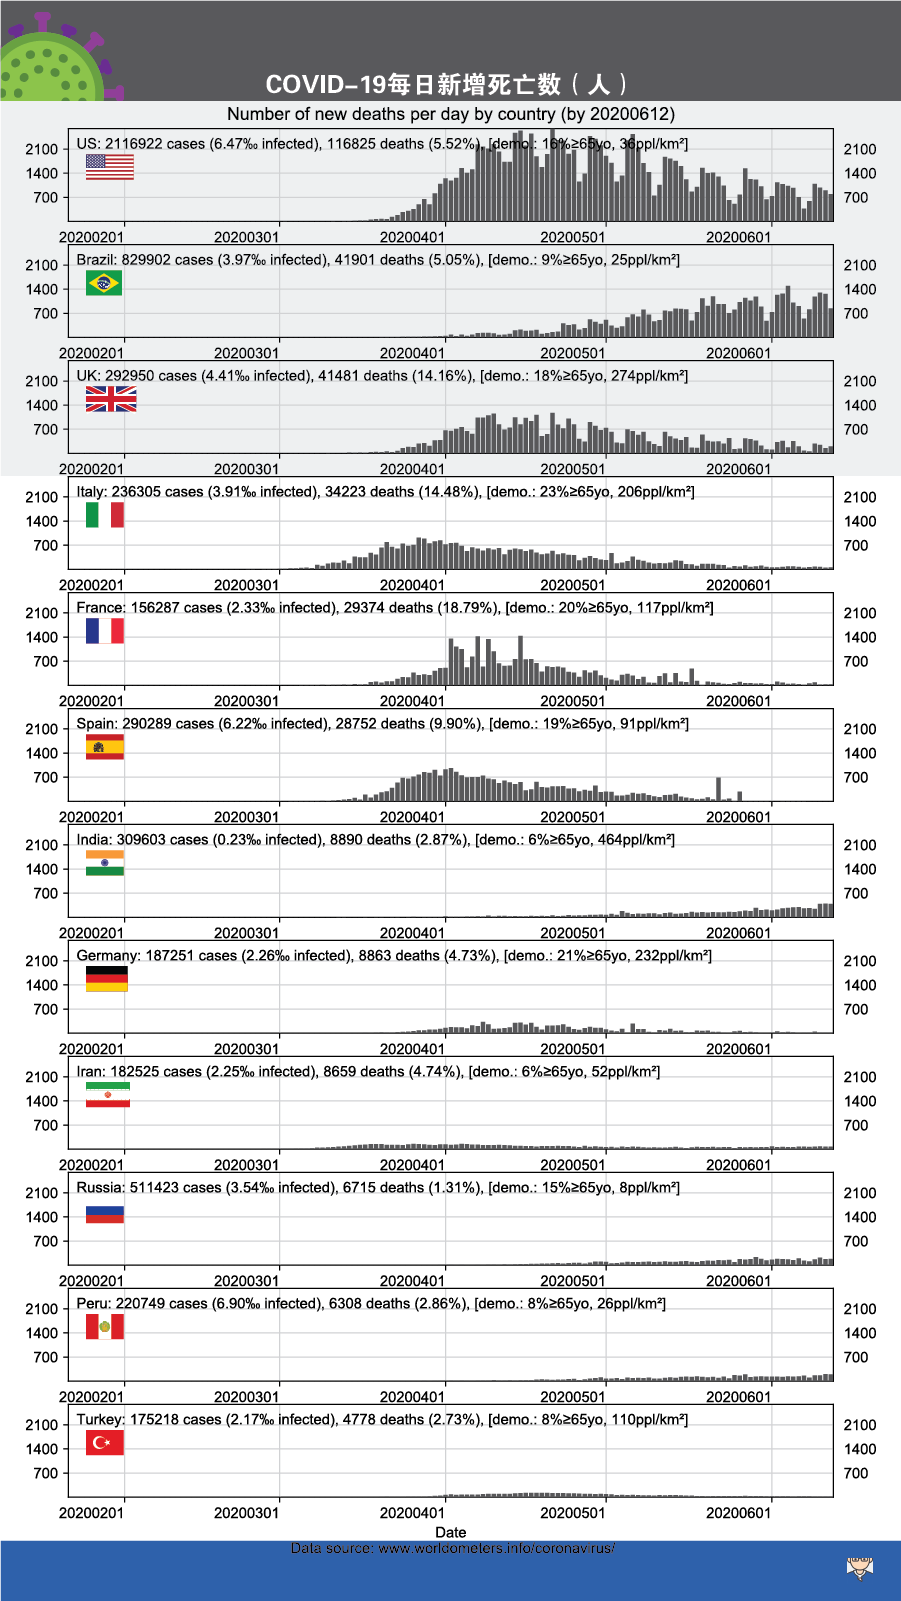
03 Number of new deaths per day by country

COVID-19  number of new deaths per day by country

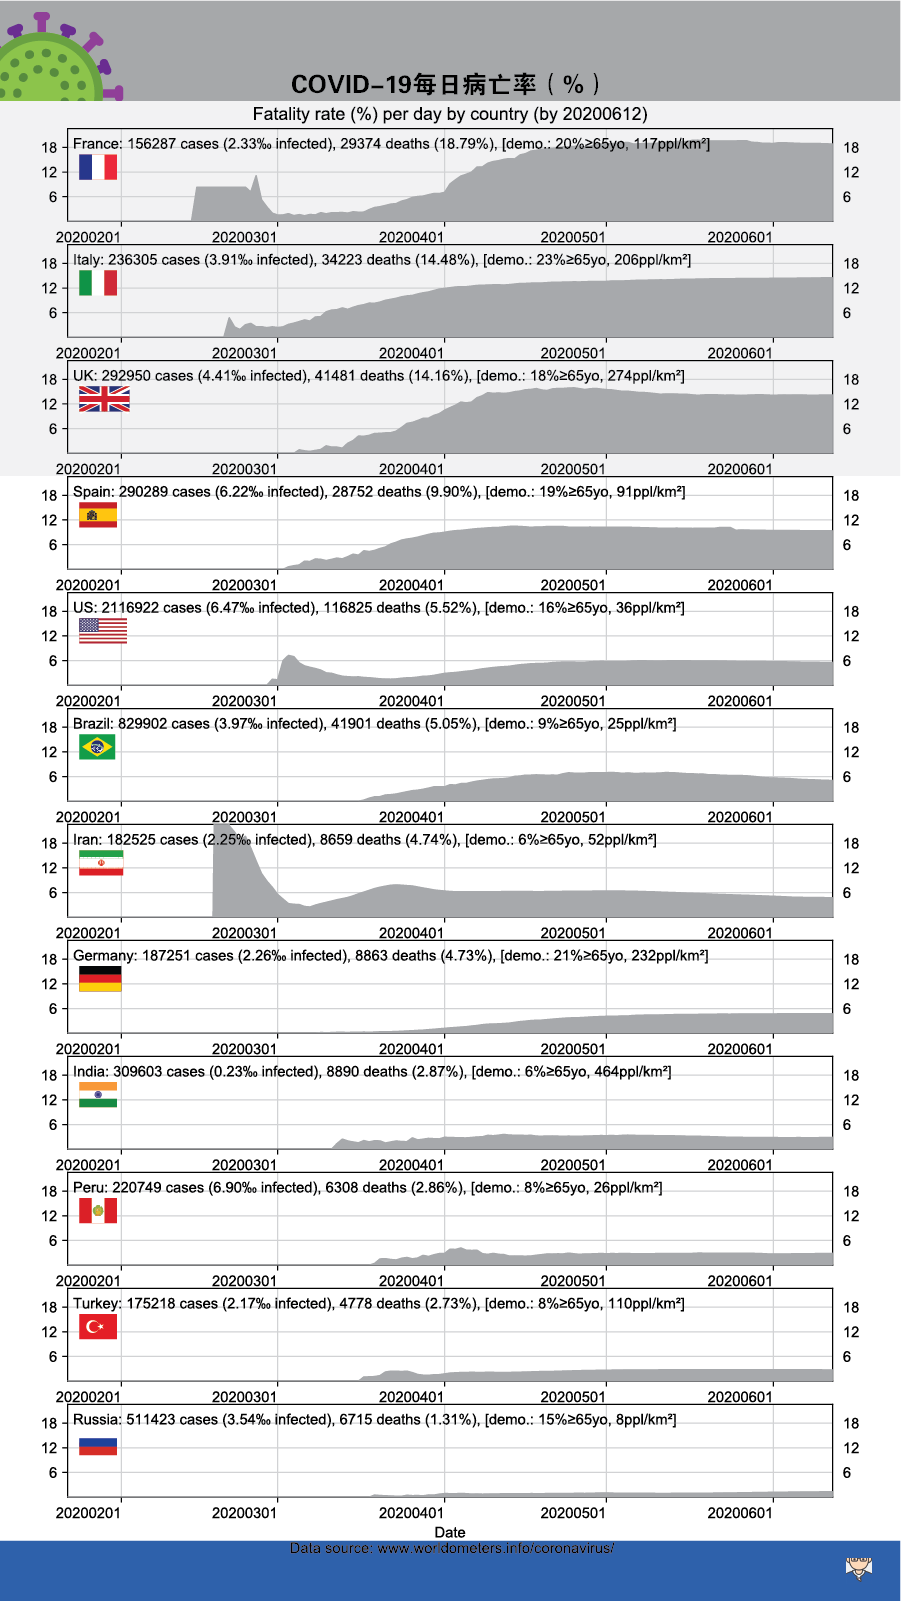
04 Fatality rate per day by country

Fatality rate := num. of total cases/num. of total deaths
COVID-19 fatality rate per day by country