-
Notifications
You must be signed in to change notification settings - Fork 20
ebt_integration_error
Issues with computing the total leaf assimilation -- in particular when the first derivative is not defined/well behaved because of differences in how the adaptive integration proceeds -- causes the EBT to come to a grinding halt. This issue affects the different gradient calculations differently (forward/backward/centred differencing) as it requires a very precice set of conditions. As such, this might not actually be replicatable on different machines, with errors occuring at different places.
This bug can be removed by setting plant_assimilation_reuse_intervals to TRUE (the current default), and this file mostly exists to motivate the existence of some ugly design decisions through Plant and CohortTop.
There is nothing particularly magic about the parameters chosen; they are just the parameters for which I found the problem.
With forward: failure at addition 18 With backward: .................. 60 With richardson: ................ 41 -- fails differently?
library(tree)## Loading required package: Rcpp
Misc functions for setting up times:
cohort.introduction.times <- function(max.time, multiplier=0.2,
                                      min.step.size=1e-05,
                                      max.step.size=2) {
  if (min.step.size <= 0)
    stop("The minimum step size must be greater than zero")
  trim <- function(x)
    max(min(x, max.step.size), min.step.size)
  times <- numeric(0)
  dt <- time <- 0
  while (time <= max.time) {
    times <- c(times, time)
    time <- time + trim(time * multiplier)
  }
  times
}
insert.time <- function(i, x) {
  j <- seq_len(i)
  c(x[j], (x[i] + x[i+1])/2, x[-j])
}

p <- new(Parameters)
p$add_strategy(new(Strategy))

p$seed_rain <- 1.1
p$set_parameters(list(patch_area=1.0)) # See issue #13
Relatively quick control settings:
ctrl.new <- list()
ctrl.new$environment_light_rescale_usually <- TRUE
ctrl.new$environment_light_tol <- 1e-4
ctrl.new$plant_assimilation_rule <- 21
ctrl.new$plant_assimilation_over_distribution <- FALSE
ctrl.new$plant_assimilation_tol <- 1e-4
Set this to TRUE to make the problem go away
ctrl.new$plant_assimilation_reuse_intervals <- FALSE
ctrl.new$ode_tol_rel <- 1e-4
ctrl.new$ode_tol_abs <- 1e-4
ctrl.new$ode_step_size_max <- 5
p$set_control_parameters(ctrl.new)

p$seed_rain <- 50

t.max <- 104
tt.1 <- cohort.introduction.times(t.max)

get.vars <- function(obj) {
  vars <- as.data.frame(matrix(obj$ode_values, ncol=4, byrow=TRUE))
  names(vars) <- c("height", "mort", "fec", "density")
  vars
}
Failure during forward differencing:
ctrl.new$cohort_gradient_richardson <- FALSE
ctrl.new$cohort_gradient_direction <- 1 # forward difference
p$set_control_parameters(ctrl.new)
sched <- new(CohortSchedule, p$size)
sched$set_times(insert.time(18, tt.1), 1)
sched$max_time <- max(t.max)
ebt <- new(EBT, p)
ebt$cohort_schedule <- sched
while (ebt$cohort_schedule$remaining > 0)
ebt$run_next()## Error: Detected non-finite contribution
t.f <- ebt$timeNow, rerun up to the time where failure will occur (avoids doing a partial step).
ebt <- new(EBT, p)
ebt$cohort_schedule <- sched
while (ebt$cohort_schedule$remaining > 0 && ebt$time < t.f)
  ebt$run_next()
Now, start poking about
patch <- ebt$patch

cur.v <- as.data.frame(t(matrix(patch$ode_values, 4)))
cur.r <- as.data.frame(t(matrix(patch$ode_rates, 4)))
names(cur.v) <- names(cur.r) <- c("height", "mort", "fec", "density")
The rate of change of density is really bad.
plot(cur.r$density)
OK, this is the point that is going to cause me trouble.
plot(cur.r$density ~ cur.v$height)
abline(v=3.35)
But there is no sign of the trouble here, so I think that we're in a good spot.
plot(cur.v$density ~ cur.v$height)
abline(v=3.35)
plot(exp(cur.v$density) ~ cur.v$height)
abline(v=3.35)
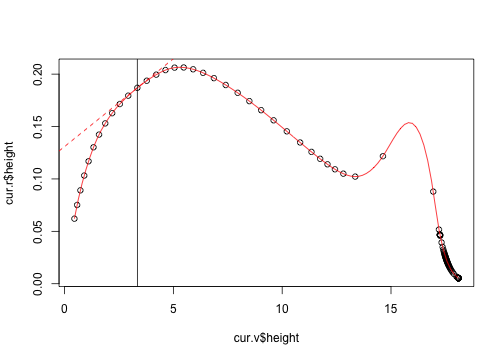
The height growth rate doesn't suggest much going on, which is odd because the gradient of this (wrt height) is part of the calculation of the rate of change of density.
plot(cur.r$height ~ cur.v$height)
abline(v=3.35)
Nor does the mortality rate (the other half of the calculation)
plot(cur.r$mort ~ cur.v$height)
abline(v=3.35)
plants <- patch[[1]]$plants
env <- patch$environment
Here we are; this totally fails at the right point:
foo.g <- sapply(plants, function(p) p$growth_rate_gradient(env))
foo.h <- sapply(plants, function(p) p$height)
plot(foo.g ~ foo.h)
abline(v=3.35)
So, why does this plant behave so differently?
idx <- which.min(foo.g)
plant <- plants[[idx]]
plant$growth_rate_gradient(env)
## [1] -26.52
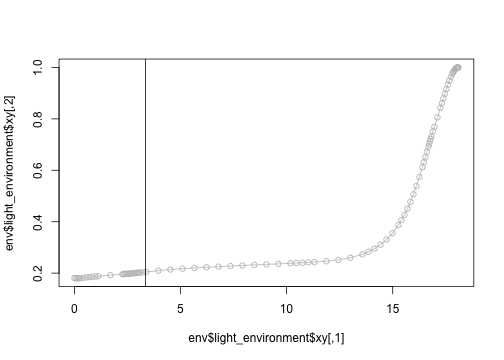
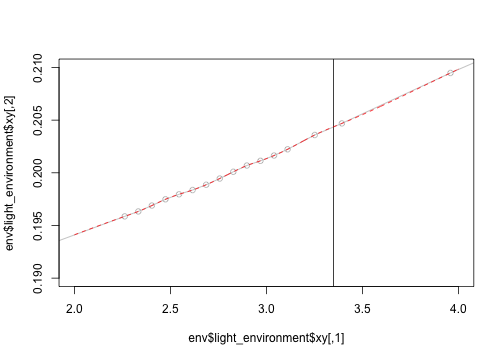
h <- plant$heightWhile this looks well behaved, it's right on the edge of a small bit of very highly sampled light environment.
plot(env$light_environment$xy, type="o", col="grey")
abline(v=3.35)
plot(env$light_environment$xy, type="o", col="grey",
     xlim=c(2, 4), ylim=c(0.19, 0.21))
abline(v=3.35)
spline <- env$light_environment
hh <- seq(2, 4, length=501)
lines(hh, spline$eval(hh), col="red", lty=2)
Next, compute the growth rate gradient a few different ways.
library(numDeriv)
gradient.fd.forward <- function(f, x, dx)
  (f(x + dx) - f(x)) / dx
gradient.fd.centre <- function(f, x, dx)
  (f(x + dx/2) - f(x - dx/2)) / dx
gradient.fd.backward <- function(f, x, dx)
  (f(x - dx) - f(x)) / (-dx)
gradient.richardson <- function(f, x, dx, eps, depth) {
  method.args <- list(d=dx, eps=eps, r=depth)
  grad(f, x, method.args=method.args)
}

make.f <- function(plant, env) {
  function(h)
    plant$growth_rate_given_height(h, env)
}

control <- p$control$parameters
Whoa: the backward does much better here, and matches well with the spline estimate. The centre and richardson versions do terribly.
(g.f <- gradient.fd.forward(make.f(plants[[idx]], env), h,
                            control$cohort_gradient_eps))
## [1] -26.52
(g.b <- gradient.fd.backward(make.f(plants[[idx]], env), h,
                             control$cohort_gradient_eps))
## [1] 0.01752
(g.c <- gradient.fd.centre(make.f(plants[[idx]], env), h,
                           control$cohort_gradient_eps))
## [1] -26.52
This is not much better.
(g.r <- gradient.richardson(make.f(plants[[idx]], env), h,
                            control$cohort_gradient_eps,
                            control$cohort_gradient_eps,
                            control$cohort_gradient_richardson_depth))
## [1] -38.55
plot(cur.r$height ~ cur.v$height)
abline(v=3.35)
fit <- splinefun(cur.v$height, cur.r$height)plot(cur.v$height, cur.r$height)
curve(fit, add=TRUE, col="red")
fit(h, 1)## [1] 0.01676
x0 <- h
y0 <- make.f(plants[[idx]], env)(x0)
abline(y0 - c(g.f, g.b, g.c, g.r) * x0, c(g.f, g.b, g.c, g.r))

fit(h)
## [1] 0.1869
fit(h, 1) # different again, but not very.## [1] 0.01676
g.s <- fit(h, 1)
abline(y0 - g.s * x0, g.s, col="red", lty=2)
So, what is going on around that point?
eps <- control$cohort_gradient_eps
f <- make.f(plants[[idx]], env)
f(h)
## [1] 0.1869
f(h + eps)## [1] 0.1869
f(h - eps)## [1] 0.1869
hh <- seq(h - 10*eps, h + 10*eps, length=101)
yy <- sapply(hh, f)
Here we go. It's not a huge change, but there is basically a small step in the calculation. My guess is that is coming from a difference in how we compute the assimilation using the adaptive integration routine.
plot(yy ~ hh)
abline(v=h + c(-eps, 0, eps))
make.g <- function(plant, env) {
  function(h) {
    plant$height <- h
    plant$compute_vars_phys(env)
    plant$vars_phys[["assimilation"]]
  }
}
Bingo. So, we need to be able to get and set parameters on exactly how the integration works.
aa <- sapply(hh, make.g(plants[[idx]], env))
plot(aa ~ hh)
abline(v=h + c(-eps, 0, eps))
Quicker, self contained example, derived using dput() on the inputs above.
ode.values <- c(3.34466942878049, 6.49570744663801,
                2.01686759346824e-19, -1.04761954482222)
pl <- new(CohortTop, p[[1]])
pl$set_ode_values(NA, ode.values)

e2 <- new(Environment, p)
e2$time <- 86.0951665778996
# light environment:
env.h <- c(0, 0.0706915821240676, 0.141383164248135,
0.212074746372203, 0.282766328496271, 0.424149492744406,
0.565532656992541, 0.706915821240677, 0.848298985488812,
0.989682149736947, 1.13106531398508, 1.69659797097762,
2.26213062797016, 2.33282221009423, 2.4035137922183, 2.47420537434237,
2.54489695646644, 2.6155885385905, 2.68628012071457, 2.75697170283864,
2.82766328496271, 2.89835486708677, 2.96904644921084,
3.03973803133491, 3.11042961345898, 3.25181277770711,
3.39319594195525, 3.95872859894779, 4.52426125594033,
5.08979391293287, 5.65532656992541, 6.22085922691795,
6.78639188391049, 7.35192454090303, 7.91745719789558,
8.48298985488812, 9.04852251188066, 9.6140551688732, 10.1795878258657,
10.462354154362, 10.7451204828583, 11.0278868113546, 11.3106531398508,
11.8761857968434, 12.4417184538359, 13.0072511108284, 13.572783767821,
13.8555500963173, 14.1383164248135, 14.4210827533098,
14.7038490818061, 14.9866154103023, 15.2693817387986,
15.4107649030467, 15.5521480672949, 15.693531231543, 15.8349143957912,
15.9762975600393, 16.1176807242874, 16.2590638885356,
16.4004470527837, 16.4711386349078, 16.5418302170318,
16.6125217991559, 16.68321338128, 16.718559172342, 16.753904963404,
16.7892507544661, 16.8245965455281, 16.8952881276522,
16.9659797097762, 17.1073628740244, 17.2487460382725,
17.3194376203966, 17.3901292025206, 17.4608207846447,
17.5315123667688, 17.6022039488928, 17.6728955310169, 17.743587113141,
17.814278695265, 17.8496244863271, 17.8849702773891, 17.9203160684512,
17.9556618595132, 17.9910076505752, 18.0263534416372,
18.0440263371683, 18.0616992326993, 18.0793721282303,
18.0970450237613)
env.o <- c(0.180486337142568, 0.180486337147787, 0.180486358518567, 0.18048910685609,
0.18057013205017, 0.181712264219988, 0.183246579686081, 0.184580211455342,
0.185751692246158, 0.186874327813336, 0.188115432978489, 0.192059634941895,
0.195864177118023, 0.196331582835284, 0.19689106805119, 0.197484908266511,
0.197959184020857, 0.198364214257562, 0.198865369451569, 0.199455292298381,
0.20009611549665, 0.200691866220595, 0.20113620232289, 0.201639517788639,
0.202232194744203, 0.203589479866637, 0.204690812019126, 0.209479015256088,
0.213950029750206, 0.21745336289642, 0.220313915636523, 0.222857540130059,
0.225259935665538, 0.227615327753224, 0.22986760144921, 0.231979570816353,
0.234019648981187, 0.236082099793756, 0.238225427028091, 0.239308578304744,
0.240480646376292, 0.241660123957485, 0.242985716781975, 0.246276747950488,
0.251379306034396, 0.25967423917509, 0.273175481718378, 0.28281360625541,
0.295067334289346, 0.310606138090801, 0.330255869297039, 0.355215944332385,
0.386929273497436, 0.40582052029207, 0.427022969013262, 0.450751562485298,
0.477202044101185, 0.506525692698944, 0.538791575737938, 0.573932093968063,
0.611667200427876, 0.631337780663232, 0.65140322965054, 0.671719299584378,
0.692104803547527, 0.702255627094342, 0.712336558533343, 0.722312319433006,
0.732144401834775, 0.751206598738877, 0.769261886058657, 0.805702827453308,
0.842880187718079, 0.861542718427816, 0.880089511674598, 0.89833195340525,
0.916048428056143, 0.932981518340161, 0.948835641562755, 0.963275394256344,
0.975924942918302, 0.981450058070619, 0.986368867739842, 0.990623711999896,
0.994154933024903, 0.996901104755459, 0.998799379901095, 0.999410676282478,
0.999791899250619, 0.9999680645666, 1)
env.s <- new(Interpolator)
env.s$init(env.h, env.o)
e2$light_environment <- env.s
Here is the problem:
pl$growth_rate_gradient(e2)## [1] -26.52